Viewing Metadata Manager Dashboard
The Metadata Manager Dashboard displays metrics that help you analyze and track your metadata. It presents this information using charts and graphs in a card format. By default, the dashboard displays information derived from all the assets. You can configure it to display only the information derived from the data that is assigned to you. For more information, refer to the Configuring Asset Settings topic.
To access Metadata Manager Dashboard, go to Application Menu > Data Catalog > Metadata Manager > Dashboard.

Each card is clickable and displays information points using charts or graphs that provide a snapshot of the underlying data.
|
UI Section |
Function |
|---|---|
|
It displays the number of each type of technical assets (systems, environments, tables, and columns) and the distribution of sensitive metadata across these technical assets. |
|
|
It displays the distribution of environments based on database type. |
|
|
It displays top systems or environments based on number of columns used in mappings. |
|
|
It displays the distribution of sensitive columns based on SDI classification across all the systems. |
|
|
It displays the number of sensitive columns and their SDI classifications in a system or environment. |
|
|
It displays top technical assets based on their number of associations. |
|
|
It displays top systems or environments based on their number of tables and columns. |
|
|
It displays a list of environments that are scheduled for a metadata scan. |
|
|
It displays a list of recently refreshed environments. |
The Enterprise Metadata section displays the number of each technical asset and the distribution of sensitive metadata across these technical assets. This section has four clickable technical asset-specific cards. You can use them to drill down further and view technical asset details.
Systems
The Systems card displays the total number of systems and the number of sensitive systems. For example, the following Systems card displays that there are 21 systems, out of which three systems are sensitive.
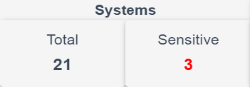
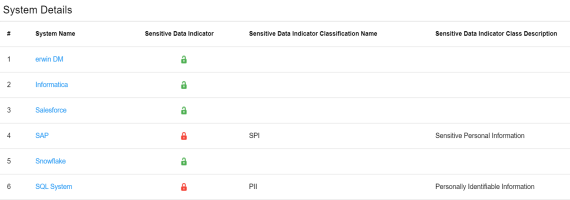
You can drill down and view the list of systems and their sensitivity. To view the list of systems, on the Systems card, click Total. The System Details page appears. On this page, you can click a system name to navigate to a system and work on it.
To focus on a list of sensitive systems only and view their details, on the Systems card, click Sensitive. The System Details page appears. It displays a list of sensitive systems.
Environments
The Environments card displays the total number of environments and the number of sensitive environments. For example, the following Environments card displays that there are 32 environments, out of which five environments are sensitive.
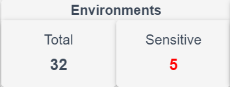
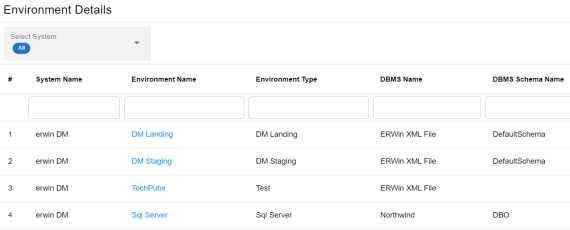
You can drill down and view the list of environments and their DBMS schema. To view the list of environments, on the Environments card, click Total. The Environment Details page appears. By default, it displays environments in all systems. On this page, you can click an environment name to navigate to an environment and work on it. Also you can use select a system in the Select System list to view environments in a specific system.
To focus on a list of sensitive environments only and view their details, on the Environments card, click Sensitive. The System Details page appears. By default, it displays a list of sensitive environments in all systems. To view sensitive environments in a specific system, you can use the Select System list.
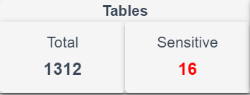
Tables
The Tables card displays the total number of tables and the number of sensitive tables. For example, the following Tables card displays that there are 1312 tables, out of which 16 tables are sensitive.
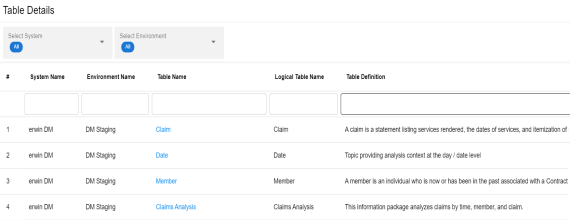
You can drill down and view the list of tables. To view the list of tables, on the Tables card, click Total. The Table Details page appears. By default, it displays a list of tables in all systems and environments. On this page, you can click a table name to navigate to a table and work on it. You can select a system in the Select System list and an environment in the Select environment list to view tables in a specific environment.
To focus on a list of sensitive tables only and view their details, on the Tables card, click Sensitive. The Table Details page appears. By default, it displays a list of sensitive tables in all environments. To view sensitive tables in a specific environment, you can use the Select System and Select Environment lists.
Columns
The Columns card displays the total number of columns and the number of sensitive columns. For example, the following Columns card displays that there are 15813 columns, out of which 50 are sensitive.

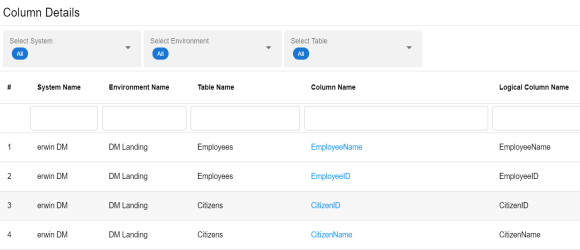
You can drill down and view the list of columns. To view the list of columns, on the Columns card, click Total. The Column Details page appears. By default, it displays a list of columns in all tables. On this page, you can click a column name to navigate to a column and work on it. Also, you can select a system in the Select System list, select an environment in the Select Environment list, and select a table in the Select Table list to view columns in a specific table.
To focus on the list of sensitive columns and view their details, on the Columns card, click Sensitive. The Column Details page appears. By default, it displays a list of sensitive columns in all tables. To view sensitive columns in a specific table, you can use the Select System and Select Environment lists.
You can change the background color of the Enterprise Metadata section. To change the background color, click ![]() and then, click Background to select a color from the palette.
and then, click Background to select a color from the palette.
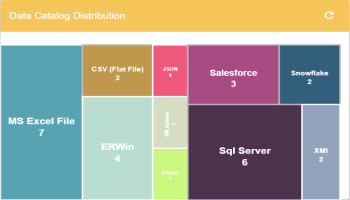
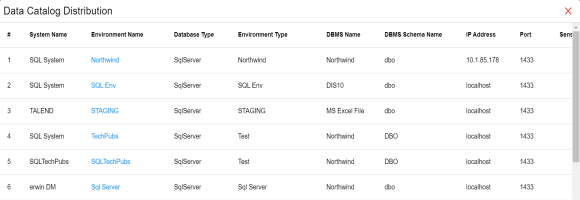
The Data Catalog Distribution card displays the number of environments based on database types. For example, the following Data Catalog Distribution card displays that there are seven CSV environments, four ERWin environments, six SQL Server environments, and so on.
You can drill down and view a list of environments belonging to a particular database type. For example, to view a list of SQL Server environments, click Sql Server. The Data Catalog Distribution page appears. On this page, you can click an environment name to navigate to an environment and work on it.
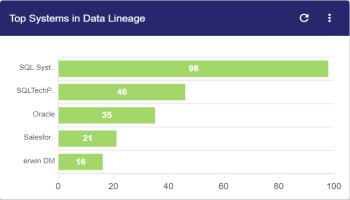
Top <Technical_Assets> in Data Lineage
The Top <Technical_Assets> chart card displays top technical assets based on the number of columns used in mappings. You can switch between the technical assets to view number of columns in systems or environments used in mappings. To switch between systems and environments, click ![]() . The available options appear. Click Change Type and then click the required technical asset.
. The available options appear. Click Change Type and then click the required technical asset.
For example, the following chart card displays top systems in data lineage. The SQL System on this chart card has 98 columns that are used in mappings.
To control the number of records appearing on the chart card, click ![]() . The available options appear. Click Records and then, click the required number.
. The available options appear. Click Records and then, click the required number.
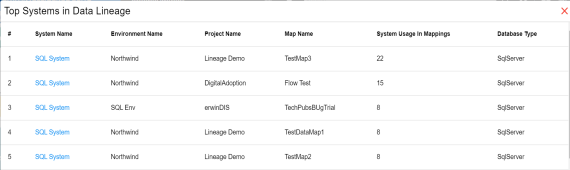
To view data lineage details of technical assets, on the chart card, click a bar graph. For example, the Top Systems in Data Lineage page appears on clicking a bar graph. On this page, you can click a system name to navigate to a system and work on it.
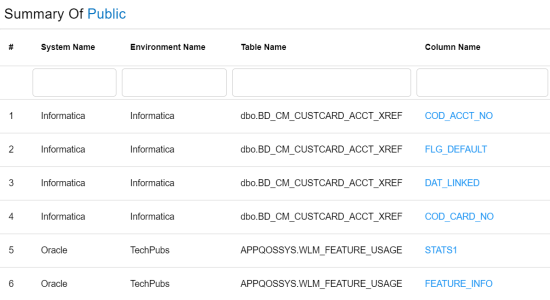
The Sensitive Data Summary chart card displays the distribution of sensitive columns based on SDI classification across all systems in a donut chart. Each arc of the donut chart corresponds to an SDI classification. For example, the following donut chart displays that 42% of the columns are Public, 2% of the columns are confidential, and so on.

Hover over the donut chart to view the absolute number of columns belonging to an SDI classification. To view columns details, click an arc. The Summary of <SDI_Classification> page appears. On this page, you can click a column name to navigate to a column and work on it.
Sensitive Data Distribution By <Technical_Assets>
The Sensitive Data Distribution By <Technical_Assets> chart card displays the number of sensitive columns and their SDI classification in a system or environment. To switch between systems and environments, click ![]() and then, click the required technical asset. For example, the following card displays the number of sensitive columns and their classification in erwin DM, Informatica, Oracle, SAP, and other systems.
and then, click the required technical asset. For example, the following card displays the number of sensitive columns and their classification in erwin DM, Informatica, Oracle, SAP, and other systems.
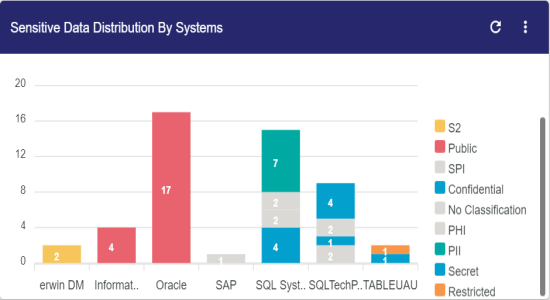
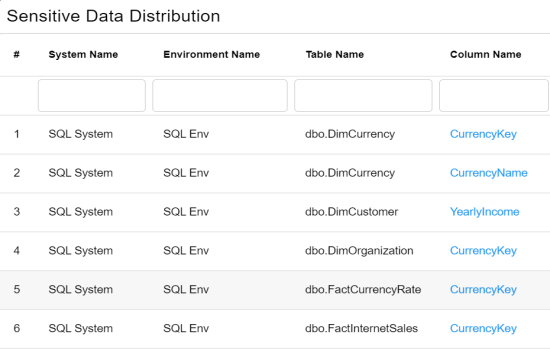
Each bar in the graph corresponds to a system or environment. You can drill down and view detailed information in the list format. To view detailed information about sensitive columns, click a bar. The Sensitive Data Distribution page appears. On this page, you can click a column name to navigate to a column and work on it.
Top <Technical_Assets> By Associations
The Top <Technical_Assets> By Associations chart card displays the top technical assets based on the number of associations it has with other assets. You can switch between technical assets to view top systems, environments, tables, or columns based on the number of associations. To switch between technical assets, click ![]() . The available options appear. Click Change Type and then, click the required technical asset. For example, the following card displays top tables based on the number of associations.
. The available options appear. Click Change Type and then, click the required technical asset. For example, the following card displays top tables based on the number of associations.

To control the number of records appearing on the chart card, click ![]() . The available options appear. Click Records and then click the required number.
. The available options appear. Click Records and then click the required number.
Each bar in the graph corresponds to a technical asset. Hover over a bar to view the number of associations.
The Top <Technical_Assets> chart card displays top systems or environments based on the number of tables and columns. To switch between systems and environments, click ![]() . The available options appear. Click Change Type and then, click the required technical asset. For example, the following chart card displays the top five systems.
. The available options appear. Click Change Type and then, click the required technical asset. For example, the following chart card displays the top five systems.

To control the number of records available on the chart, click ![]() . The available options appear. Click Records and then, click the required number.
. The available options appear. Click Records and then, click the required number.
Each pair of bars in the graph corresponds to a technical asset. Hover over green and orange bars to view the number of columns and tables respectively.
The Upcoming Scheduled Scans card displays a list of environments that are scheduled for a metadata scan. This list includes time of the scheduled scan for each environment. To control the number of records available on the chart, click ![]() . The available options appear. Click Records and then click the required number.
. The available options appear. Click Records and then click the required number.
To customize the card background, click ![]() . The available options appear. Click Background and then use the color palette. For example, the following card's background color is set to orange color.
. The available options appear. Click Background and then use the color palette. For example, the following card's background color is set to orange color.

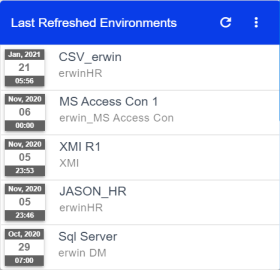
The Last Refreshed Environments card displays a list of recently refreshed environments. It displays the environment name, date, and time of the environment refresh. This helps in tracking environments that are recently updated. To control the number of records available on the chart, click ![]() . The available options appear. Click Records and then click the required number. For example, the following chart card displays a record of five environments
. The available options appear. Click Records and then click the required number. For example, the following chart card displays a record of five environments
To customize the card background, click ![]() . The available options appear. Click Background and then use the color palette.
. The available options appear. Click Background and then use the color palette.
|
|
|
Copyright © 2021 erwin, Inc. All rights reserved. Copyright © 2021 Quest Software Inc. All rights reserved. All trademarks, trade names, service marks, and logos referenced herein belong to their respective companies. |